%20--%3e%3csvg%20version='1.1'%20id='Layer_1'%20xmlns='http://www.w3.org/2000/svg'%20xmlns:xlink='http://www.w3.org/1999/xlink'%20x='0px'%20y='0px'%20viewBox='0%200%2031.9%2032'%20style='enable-background:new%200%200%2031.9%2032;'%20xml:space='preserve'%3e%3cstyle%20type='text/css'%3e%20.st0{fill:%230D7BBA;}%20%3c/style%3e%3cg%3e%3cg%3e%3cg%3e%3cg%3e%3cg%3e%3cpolyline%20class='st0'%20points='17.6,26.6%2029.4,14.8%2031.9,17.2%2017.6,31.5%205.1,18.9%207.5,16.4%20'/%3e%3c/g%3e%3c/g%3e%3c/g%3e%3cg%3e%3cg%3e%3cg%3e%3cpolygon%20class='st0'%20points='26.8,12.7%2017.7,21.8%2015.3,19.3%2021.9,12.7%2019.4,10%2012.6,16.7%2010.2,14.3%2016.8,7.6%2014.3,5%202.5,16.7%200,14.3%2014.3,0.1%20'/%3e%3c/g%3e%3c/g%3e%3c/g%3e%3c/g%3e%3c/g%3e%3c/svg%3e)
System Health — An Operational Dashboard for Monitoring Gateways and Systems
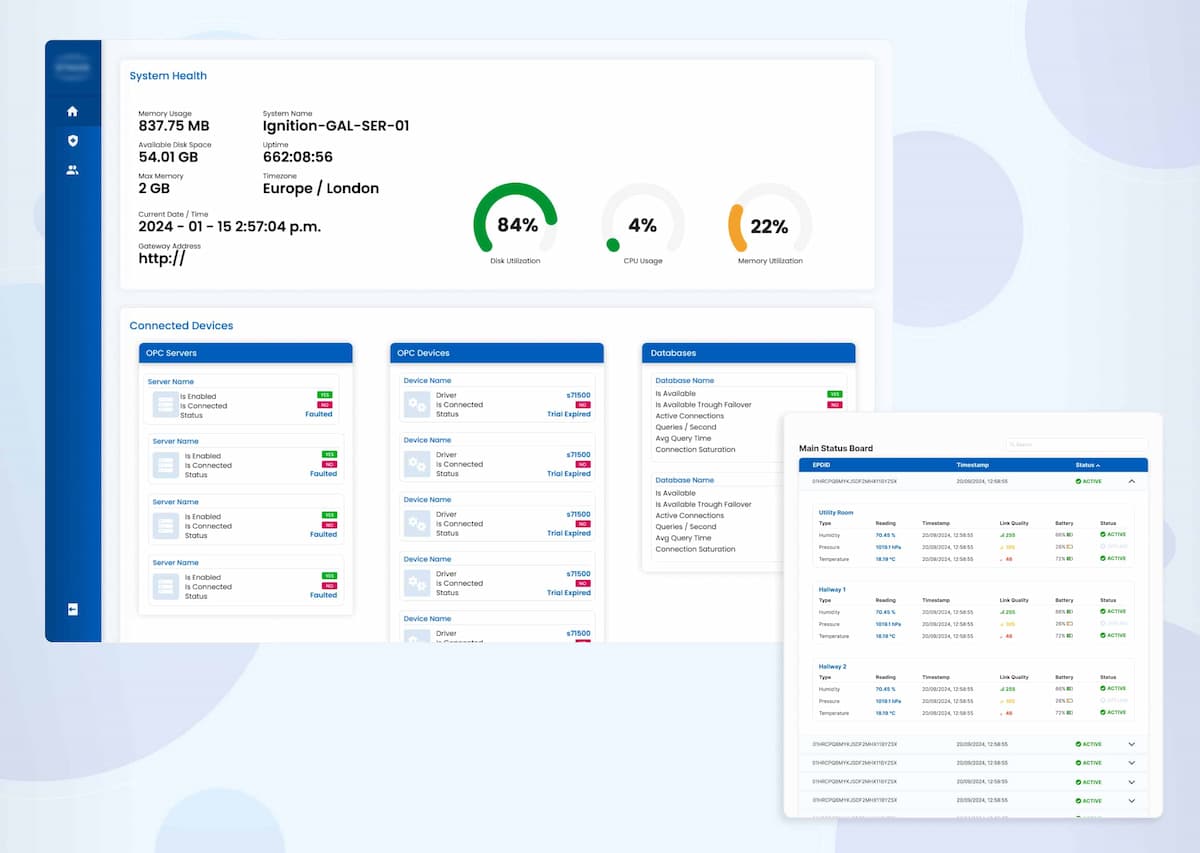
Operational dashboard for monitoring gateways, OPC devices, and databases. Clear KPIs and card modules help teams spot issues fast and navigate large systems with less noise.
Overview
An operational monitoring dashboard designed for industrial teams managing gateways, OPC devices, and databases. The interface surfaces critical KPIs and system status through clear card-based modules, enabling teams to spot issues quickly and navigate complex infrastructure with less visual noise. Built for real-world use where fast decision-making and system reliability are essential.
My Role
- UX / UI Design
- Dashboard Architecture
- Data Visualization
- Interaction Design
- Assets / Handoff
Key Features
Clear KPI cards
At-a-glance status indicators for gateways, OPC devices, and databases that surface critical information immediately.
Card-based modules
Organized, scannable modules that group related system data and reduce cognitive load for operators.
Status & health indicators
Color-coded status badges and health scores that make it easy to distinguish healthy systems from those needing attention.
System navigation
Structured navigation for large infrastructures, letting operators drill down from overview to specific device details.
Low-noise design
A minimal, focused layout that eliminates visual clutter so operators can concentrate on what matters most.
Responsive layout
Works across desktop monitors and tablets, accommodating control room setups and on-the-floor checks.
Screenshots
Tech Stack
Final Thoughts
Designing for industrial monitoring meant prioritizing clarity and speed above all else. Operators need to assess system health in seconds, not minutes. The card-based approach and color-coded indicators ensure that critical information is always visible and actionable, making this dashboard a reliable tool for teams managing complex infrastructure.
Want to see it live?